Get ready for 21st-century careers with this programming language that’s easy to learn and used across a variety of industries.
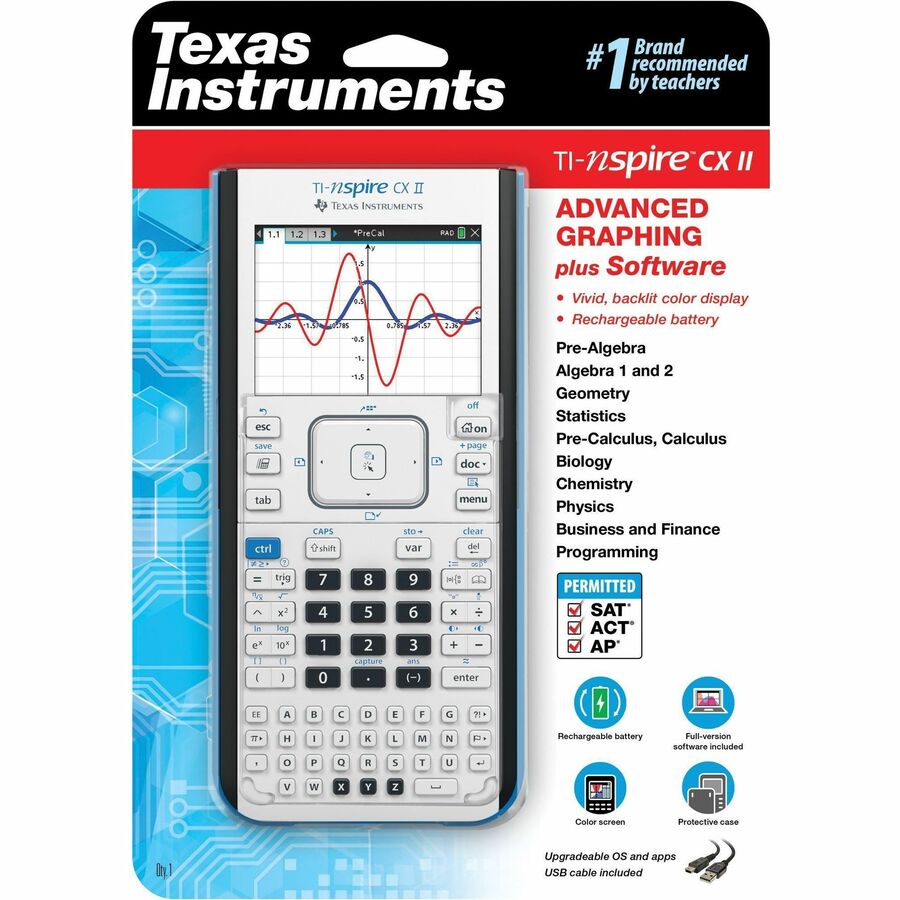
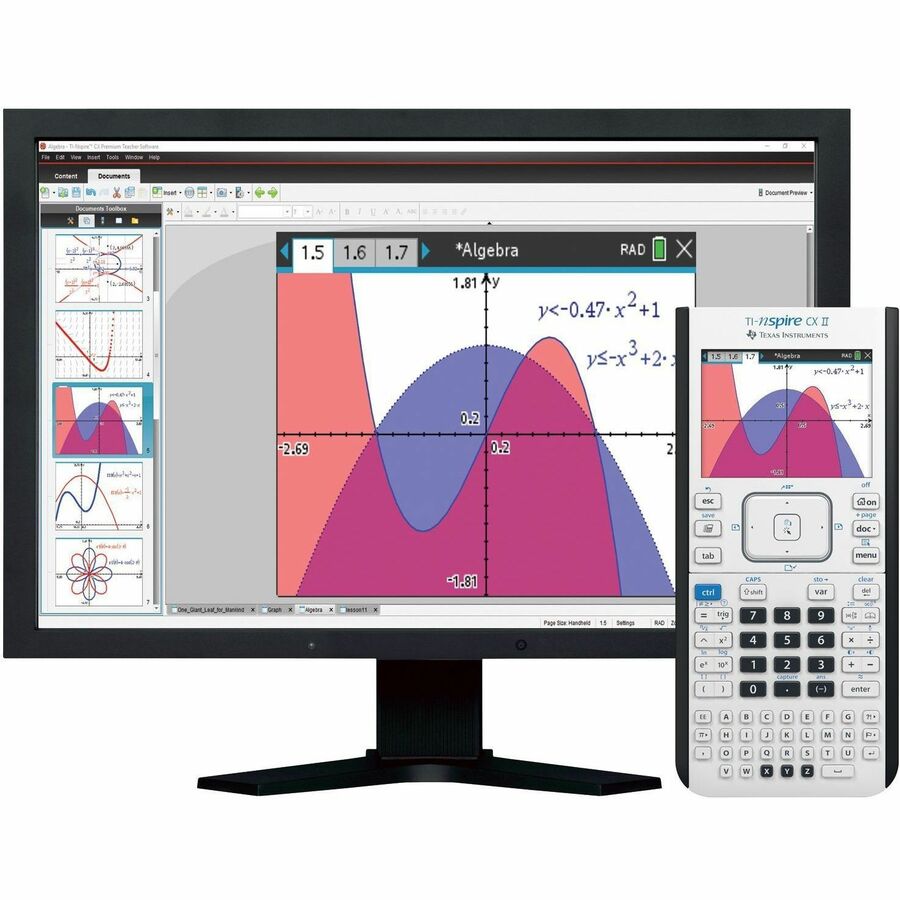
Faster performance, added interactive visuals and easier-to-read graphics expand the TI-Nspire™ CX graphing calculators’ classroom-proven ability to support inquiry and discovery.
NEW! Features include:
Animated Path Plot
Visualize function, parametric and polar graphs as they are drawn in real time.
Dynamic Coefficient Values
Explore direct connections between dynamic coefficients in equations and graphs.
Points by Coordinates
Create dynamic points defined by coordinates, sliders or expressions quickly.
Tick-Mark Labels
Label axes scales to create visual contexts that promote understanding.
Python Programming
Program easily with this coding language that’s great for STEM classes and more.
Easier to Read Graphs
New app icons, supported by color-coded screen tabs, improve the user experience.
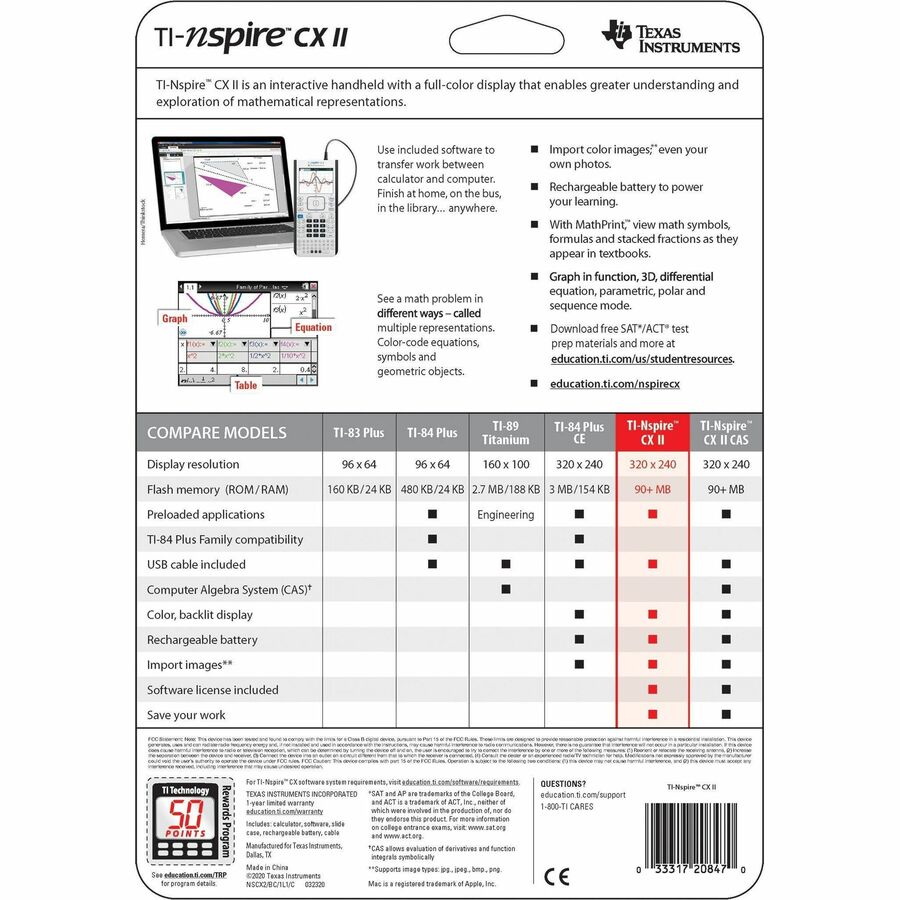
From the keyboard and computer-menu interface to the ability to save and share work with built-in apps, the TI-Nspire™ CX II models retain the features and functionality that make TI-Nspire™ CX graphing calculators ideal for math and science from middle grades through college, including:
-
Calculator: Perform computations and enter expressions, equations and formulas in proper math notation.
-
Graphs: Plot and explore functions, equations and inequalities, animate points on objects and graphs, use sliders to explain their behavior and more.
-
Geometry: Construct and explore geometric figures and create animations.
-
Vernier DataQuest™ Application: Create a hypothesis graphically and replay data collection experiments all in a single application.
-
Lists & Spreadsheet: Perform mathematical operations on data and visualize the connections between the data and their plots.
-
Data & Statistics: Summarize and analyze data using different graphical methods such as histograms, box plots, bar and pie charts and more.
-
Notes: Enter notes, steps, instructions and other comments on the screen alongside the math.
-
Programming: Add new functionality and create rich STEM activities with Python and TI-Basic coding languages.
Prepare for test success by using the exam-permitted graphing calculator in class and at home, including:
- SAT®
- AP®
- PSAT/NMSQT®
- ACT®
- IB® Diploma Programme
Built-In Functionality:
- Function, parametric, polar, sequence and 3D graphing
- Multiple graphing functions can be defined, saved, graphed and analyzed at one time
- User-defined list names in Lists & Spreadsheet
- Eleven interactive zoom features
- Numeric evaluations in table format for all graphing modes
- Interactive analysis of function values, roots, maximums, minimums, integrals and derivatives
- Six different graph styles and 15 colors to select from for differentiating the look of each graph drawn
- Matrix operations: transpose and augment matrices; use elementary row operations; find inverse, determinant and reduced row echelon forms; convert matrices to lists and vice versa; calculate eigenvalues and eigenvectors
- List-based one- and two-variable statistical analysis, including logistic, sinusoidal, median-median, linear, logarithmic, exponential, power, quadratic polynomial, cubic polynomial, and quartic polynomial regression models
- Three statistical plot definitions for scatter plots, xy-line plots, histograms, regular and modified box-and-whisker plots, and normal probability plots
- Advanced statistics analysis, including 10 hypothesis testing functions, seven confidence interval functions and one-way analysis of variance
- Eighteen probability distributions functions, including the cumulative distribution function (CDF), probability density function (PDF) and inverse probability distribution function for normal, chi-squared, t-, and F- distributions; and the CDF and PDF for binomial, geometric and Poisson distributions
- Built-in interactive geometry capabilities
- Quick alpha keys
- Simple drop-down menus emulate the intuitive operation of familiar computer features
- TI-Nspire™ Documents (.tns files) can be created, edited, saved and reviewed
- Use images (.jpeg, .jpg, .bmp, .png formats) that can be overlaid with graphical elements
- Explore mathematical expressions in symbolic form, see patterns and understand the math behind the formulas
- Visualize multiple representations of a single problem-algebraic, graphical, geometric, numeric and written
- Chem Box feature allows easy input of chemical formulas and equations
- Manipulate linked representations of properties to instantly update the others and show meaningful connections without switching screens (for example, grab a graphed function and move it to see the effect on corresponding equations and data lists)
Programming:
- Different options for coding languages including Python and TI-Basic.
- Features a dedicated programming environment as well as programming libraries for global access to user-defined functions and programs.
Data Collection Support:
- Compatible with TI-Nspire™ Lab Cradle, Vernier EasyLink® USB Sensor and Vernier EasyTemp® USB temperature sensor systems to allow collection and analysis of real-world data
/eh/2025-01-08/173633966714069467/picture.png)

/eh/2025-07-08/1751962110204480194/picture.png)
/eh/2025-06-21/1750485478958537574/countryInfoIcon.png)
/eh/2025-06-21/1750485741321434291/Hi-Sign-in-My-Nihao.png)
/eh/2025-06-21/1750485837193896318/cart.png)
/eh/2025-06-21/1750485968202533847/cart.png)
/eh/2025-04-17/1744862476612819675/hot-img.png)


